Performance Browser Tool
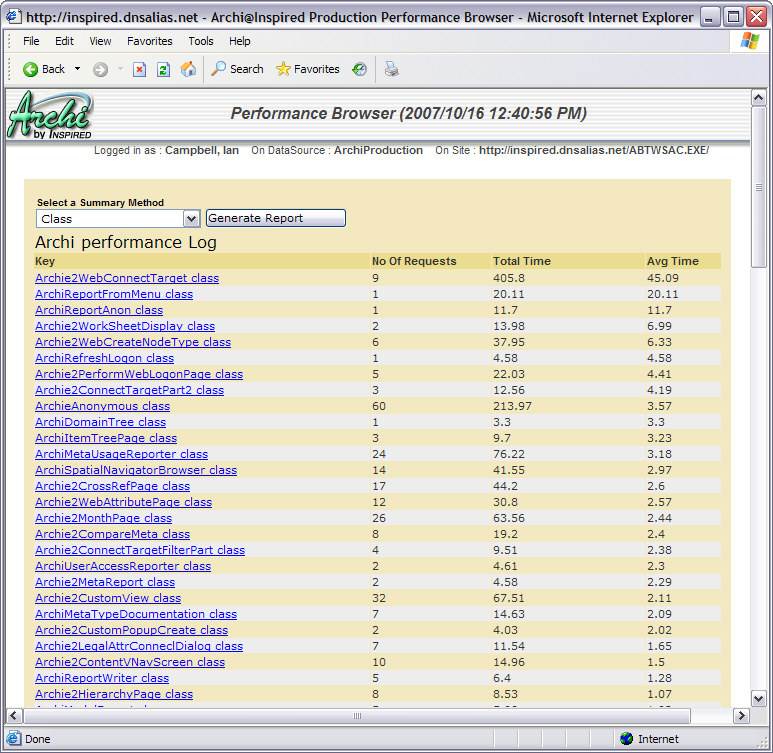
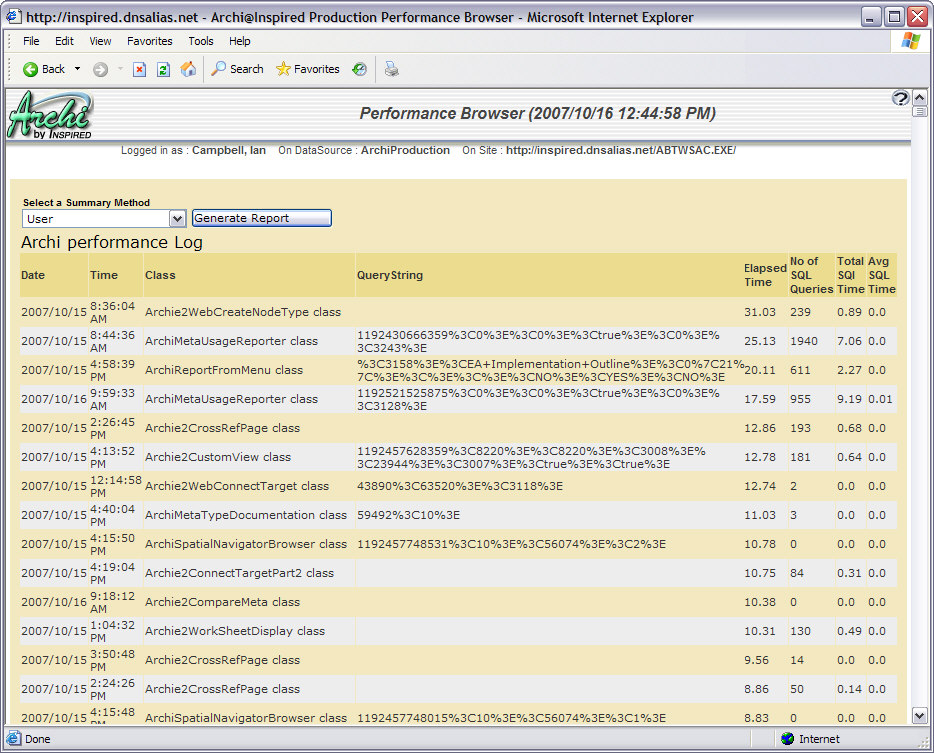
In a large installation with many users, performance (response time and run time of reports and other batch activity) can become an issue. EVA Netmodeler provides a subsystem to assist with the monitoring, reporting and
management of performance. The performance browser allows you to view the performance of the server and the database since it was started. You can choose to view information by response time, user, date, class (type of request
made) or globally. When you have selected a category, you can drill down for further information. If you wish, you can also reset the performance data log.


|